


Bridging the gap: How ConnectKentucky pioneered broadband mapping
This is part 2 of the two-part series Bridging the Gap by Nathan Smith.
Bowling Green, Ky. (March 31, 2026) - Some inventions seem obvious only after they exist. Broadband mapping is one of them.
Twenty-five years ago, the Center for Information Technology Enterprise (CITE) was founded as a nonprofit consultancy dedicated to fostering technology-driven economic development in Western Kentucky. In working with businesses and communities across the region, the organization quickly discovered a major obstacle: large portions of the state lacked broadband connectivity.
Without high-speed internet, rural communities struggled to attract technology firms, support modern industries, or participate in the emerging digital economy.
State leaders took notice. Kentucky’s innovation strategy — later championed by Gov. Ernie Fletcher — recognized that economic competitiveness required statewide broadband availability. Those efforts soon evolved into ConnectKentucky, a public-private initiative supported by the Fletcher administration that aimed to accelerate broadband deployment and adoption across the state.
As part of its mission, the project received a grant to create a broadband mapping initiative.
Using geographic information system (GIS) tools, ConnectKentucky assembled data directly from internet service providers and combined it with geographic datasets to visualize where broadband services — such as DSL and cable modem — were actually available.
The resulting map, released in 2005, is widely regarded as the first statewide broadband availability map in the United States.
But the initiative went beyond mapping infrastructure. ConnectKentucky paired technical work with community engagement through local “e-teams” composed of volunteers from business, government, agriculture, and education. These groups helped identify barriers to deployment and encourage adoption.
ConnectKentucky also benefited from a distinctive institutional position. As a mission-driven nonprofit rather than a government agency, it could collect sensitive provider data under confidentiality protections that encouraged industry participation.
Thousands of Kentuckians contributed to the effort. The resulting maps revealed patterns that had previously been difficult to see: broadband clustered around cities and transportation corridors, while many rural areas had few or no options.
For the first time, policymakers could clearly see the geography of the Digital Divide.
The idea proved influential. Other states began exploring similar mapping efforts, and federal policymakers started asking whether a comparable map might be created for the entire country.
The Digital Divide, it turned out, could be mapped. The approach pioneered in Kentucky — collecting provider data and visualizing broadband coverage through GIS — eventually influenced how broadband deployment was measured nationwide.
From state experiments to national data
The logic of the Kentucky experiment eventually scaled nationwide — and CN was central to that expansion.
What began as a statewide initiative, ConnectKentucky grew into a multistate operation and was rebranded as Connected Nation in 2011. By then, CN had already established itself as a trusted partner for broadband data collection, positioning the organization to play a leading role when federal funding arrived.
In 2009, Congress funded broadband mapping through the American Recovery and Reinvestment Act. The National Telecommunications and Information Administration (NTIA) launched the State Broadband Initiative (SBI), which supported broadband data collection across the country. CN served as the “designated entity” for many states, including Michigan, Minnesota, and Tennessee, using states’ federal grants to create broadband maps for each state client.
States gathered deployment data and submitted it to NTIA, which aggregated the information into the National Broadband Map, first released in 2011.
For the first time, the United States had a publicly accessible nationwide broadband map.
When SBI funding expired, the federal support for state-level mapping lapsed. To fill the gap, the FCC revised Form 477 in 2013 to require providers to report deployment data.
Over time, the resulting maps became the primary national source of broadband availability information. Policymakers used them to target subsidies through programs such as the Connect America Fund and later the Rural Digital Opportunity Fund.
Broadband mapping had become an essential part of telecommunications policy — but its limitations were increasingly obvious.
The Broadband DATA Act
By the late 2010s, dissatisfaction with Form 477 was widespread. Researchers, state officials, and local governments argued that census-block reporting overstated coverage, particularly in rural areas.
If federal programs were going to direct tens of billions of dollars toward closing the Digital Divide, they needed far more precise data.
Congressional efforts to solve the problem began with S.1522 (2019), the Broadband Data Improvement Act of 2019, to which CN contributed with drafting assistance and advocacy. Like the later Broadband DATA Act, it sought to overhaul federal broadband mapping — requiring more granular service-availability data from providers, incorporating state and local government data, and establishing a formal challenge process. Those ideas later became central features of S. 1822 (2020), the Broadband DATA Act, enacted in March 2020. CN again helped advocate for the legislation and contributed expertise during its development.
The law required the FCC to replace census-block reporting with location-level mapping. It directed the agency to create a dataset of individual addresses and structures capable of receiving broadband service — the BSL fabric — and combine it with provider coverage data.
For the first time, policymakers could see which specific locations did and did not have broadband access.
The law also created a challenge process allowing governments and consumers to dispute provider-reported coverage.
The FCC implemented the statute through the Broadband Data Collection system, and the modern FCC National Broadband Map was released in 2022.
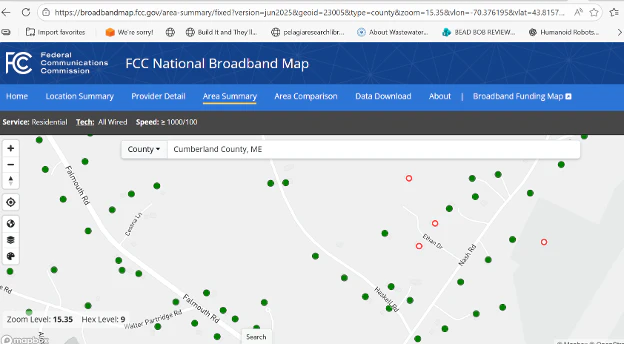
It is the most detailed broadband dataset ever produced.
Mapping and the pursuit of universal broadband
These new maps underpin the largest broadband investment in American history.
The Infrastructure Investment and Jobs Act created the BEAD program, allocating $42.45 billion to expand broadband infrastructure across the United States. The program relies on the FCC’s location-level maps to determine which homes and businesses are unserved or underserved.
In effect, the broadband map has become a critical piece of national infrastructure — an essential dataset guiding billions of dollars in investment.
The lesson is simple: You target what you measure.
As broadband mapping improved, pressure for universal coverage grew. The COVID-19 pandemic underscored how essential connectivity had become for work, education, health care, and civic life.
Earlier programs made progress but lacked sufficient funding to close the remaining gaps. By the early 2020s, Congress was prepared to commit far greater resources.
Yet even the largest programs depend on accurate information. Without reliable maps, investment decisions risk being shaped by anecdote, lobbying, or guesswork.
Good maps allow policymakers to see the whole landscape.
Making the Digital Divide visible
The history of broadband policy is not only a story of technology and infrastructure. It is also a story about information.
Before policymakers could close the Digital Divide, they first had to see it.
The first statewide broadband map in Kentucky demonstrated that broadband coverage could be measured and visualized in ways that revealed hidden gaps. Over time, that idea spread — from early state experiments to national datasets, from simple GIS maps to the detailed location-level data used today.
The Broadband DATA Act and the FCC’s modern mapping system completed the transition from rough estimates to precise geographic knowledge.
That knowledge now guides the largest broadband investment in American history.
In a sense, the Digital Divide did not simply shrink — it became visible. And once the country could see it clearly, solving it became a realistic goal.
Because everyone truly does belong in a Connected Nation.
Related articles:
About the Author
Nathan Smith, Director, Economics and Policy
In that role, Dr. Smith monitors federal broadband policy, writes public comments for federal agencies that request advice on broadband policy implementation, and helps with business development and proposals.
