


The BEAD scoreboard reveal begins
Bowling Green, Ky. (October 8, 2025) - Connected Nation has posted a BEAD Tracker to help the public follow the emerging BEAD outcomes, as announced by the states. The Tracker is populated with the latest available data released by state broadband offices. It will continue to be updated. The charts below highlight a few of the major takeaways so far.
BEAD is underspending its budget
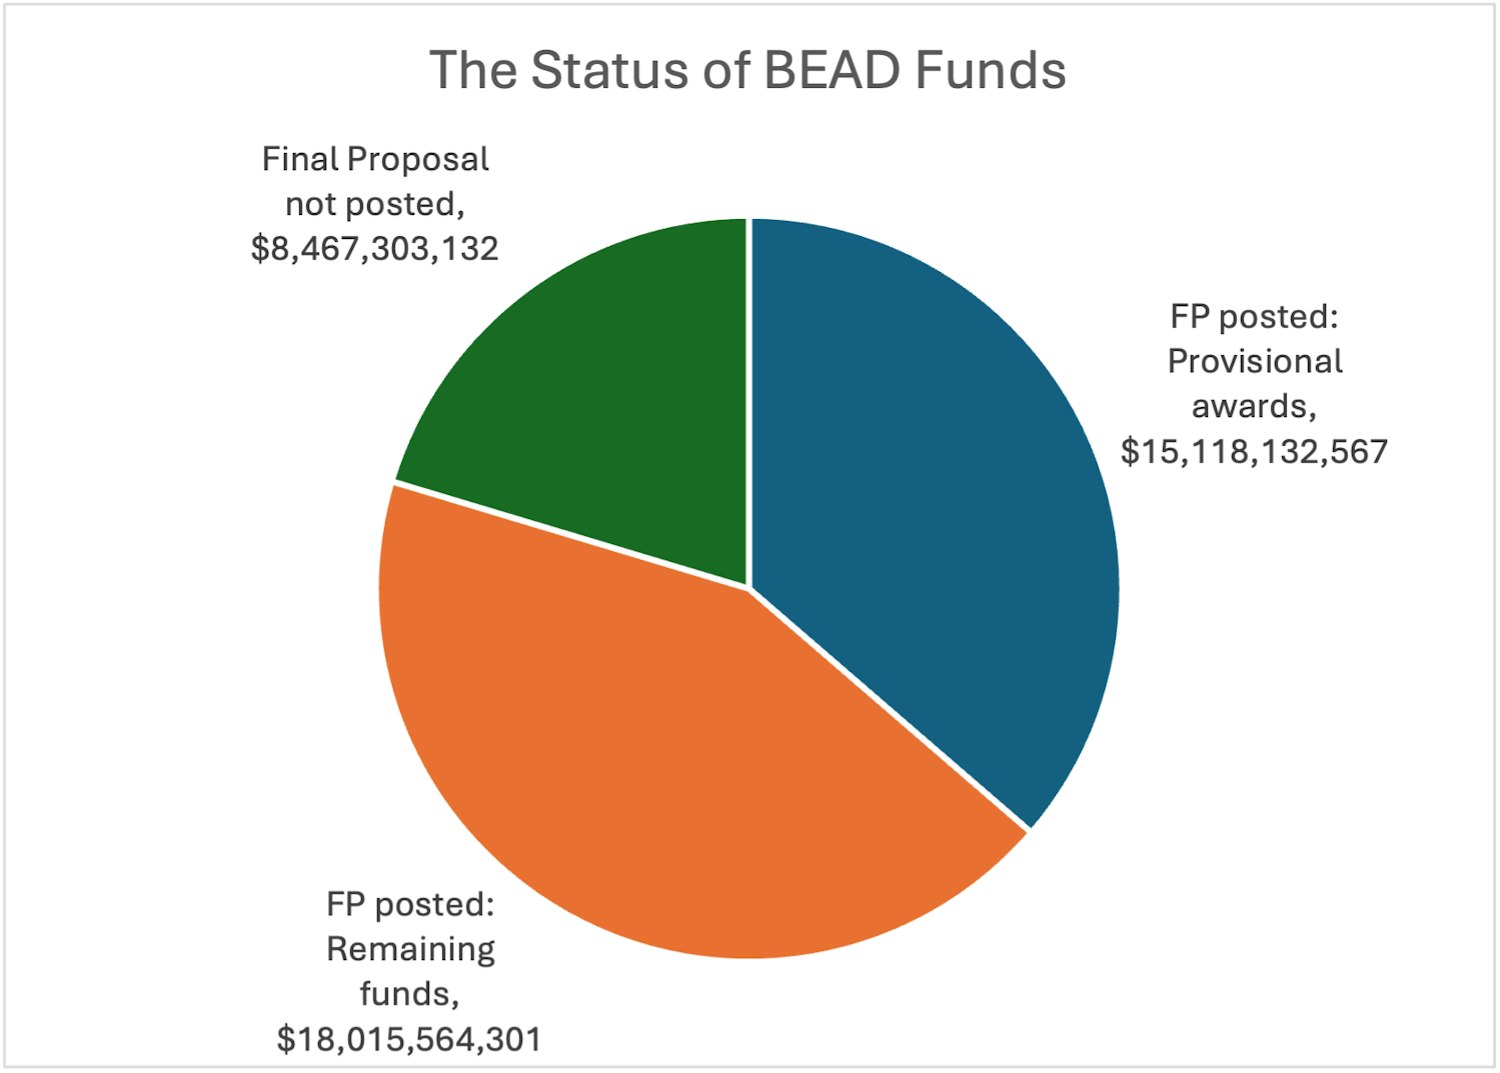
The BEAD program began with $42.45 billion in funding appropriated by Congress in the Infrastructure Investment and Jobs Act (IIJA) of November 2021. Figure 1 shows the status of this funding at the time of writing. Just over $15 billion has been provisionally awarded to projects in posted Final Proposals, awaiting NTIA approval. There was just over $18 billion in additional BEAD funding allocated to those same states, while $8.5 billion was allocated to states that have not yet posted their Final Proposals.
Figure 1: The status of BEAD funding nationally
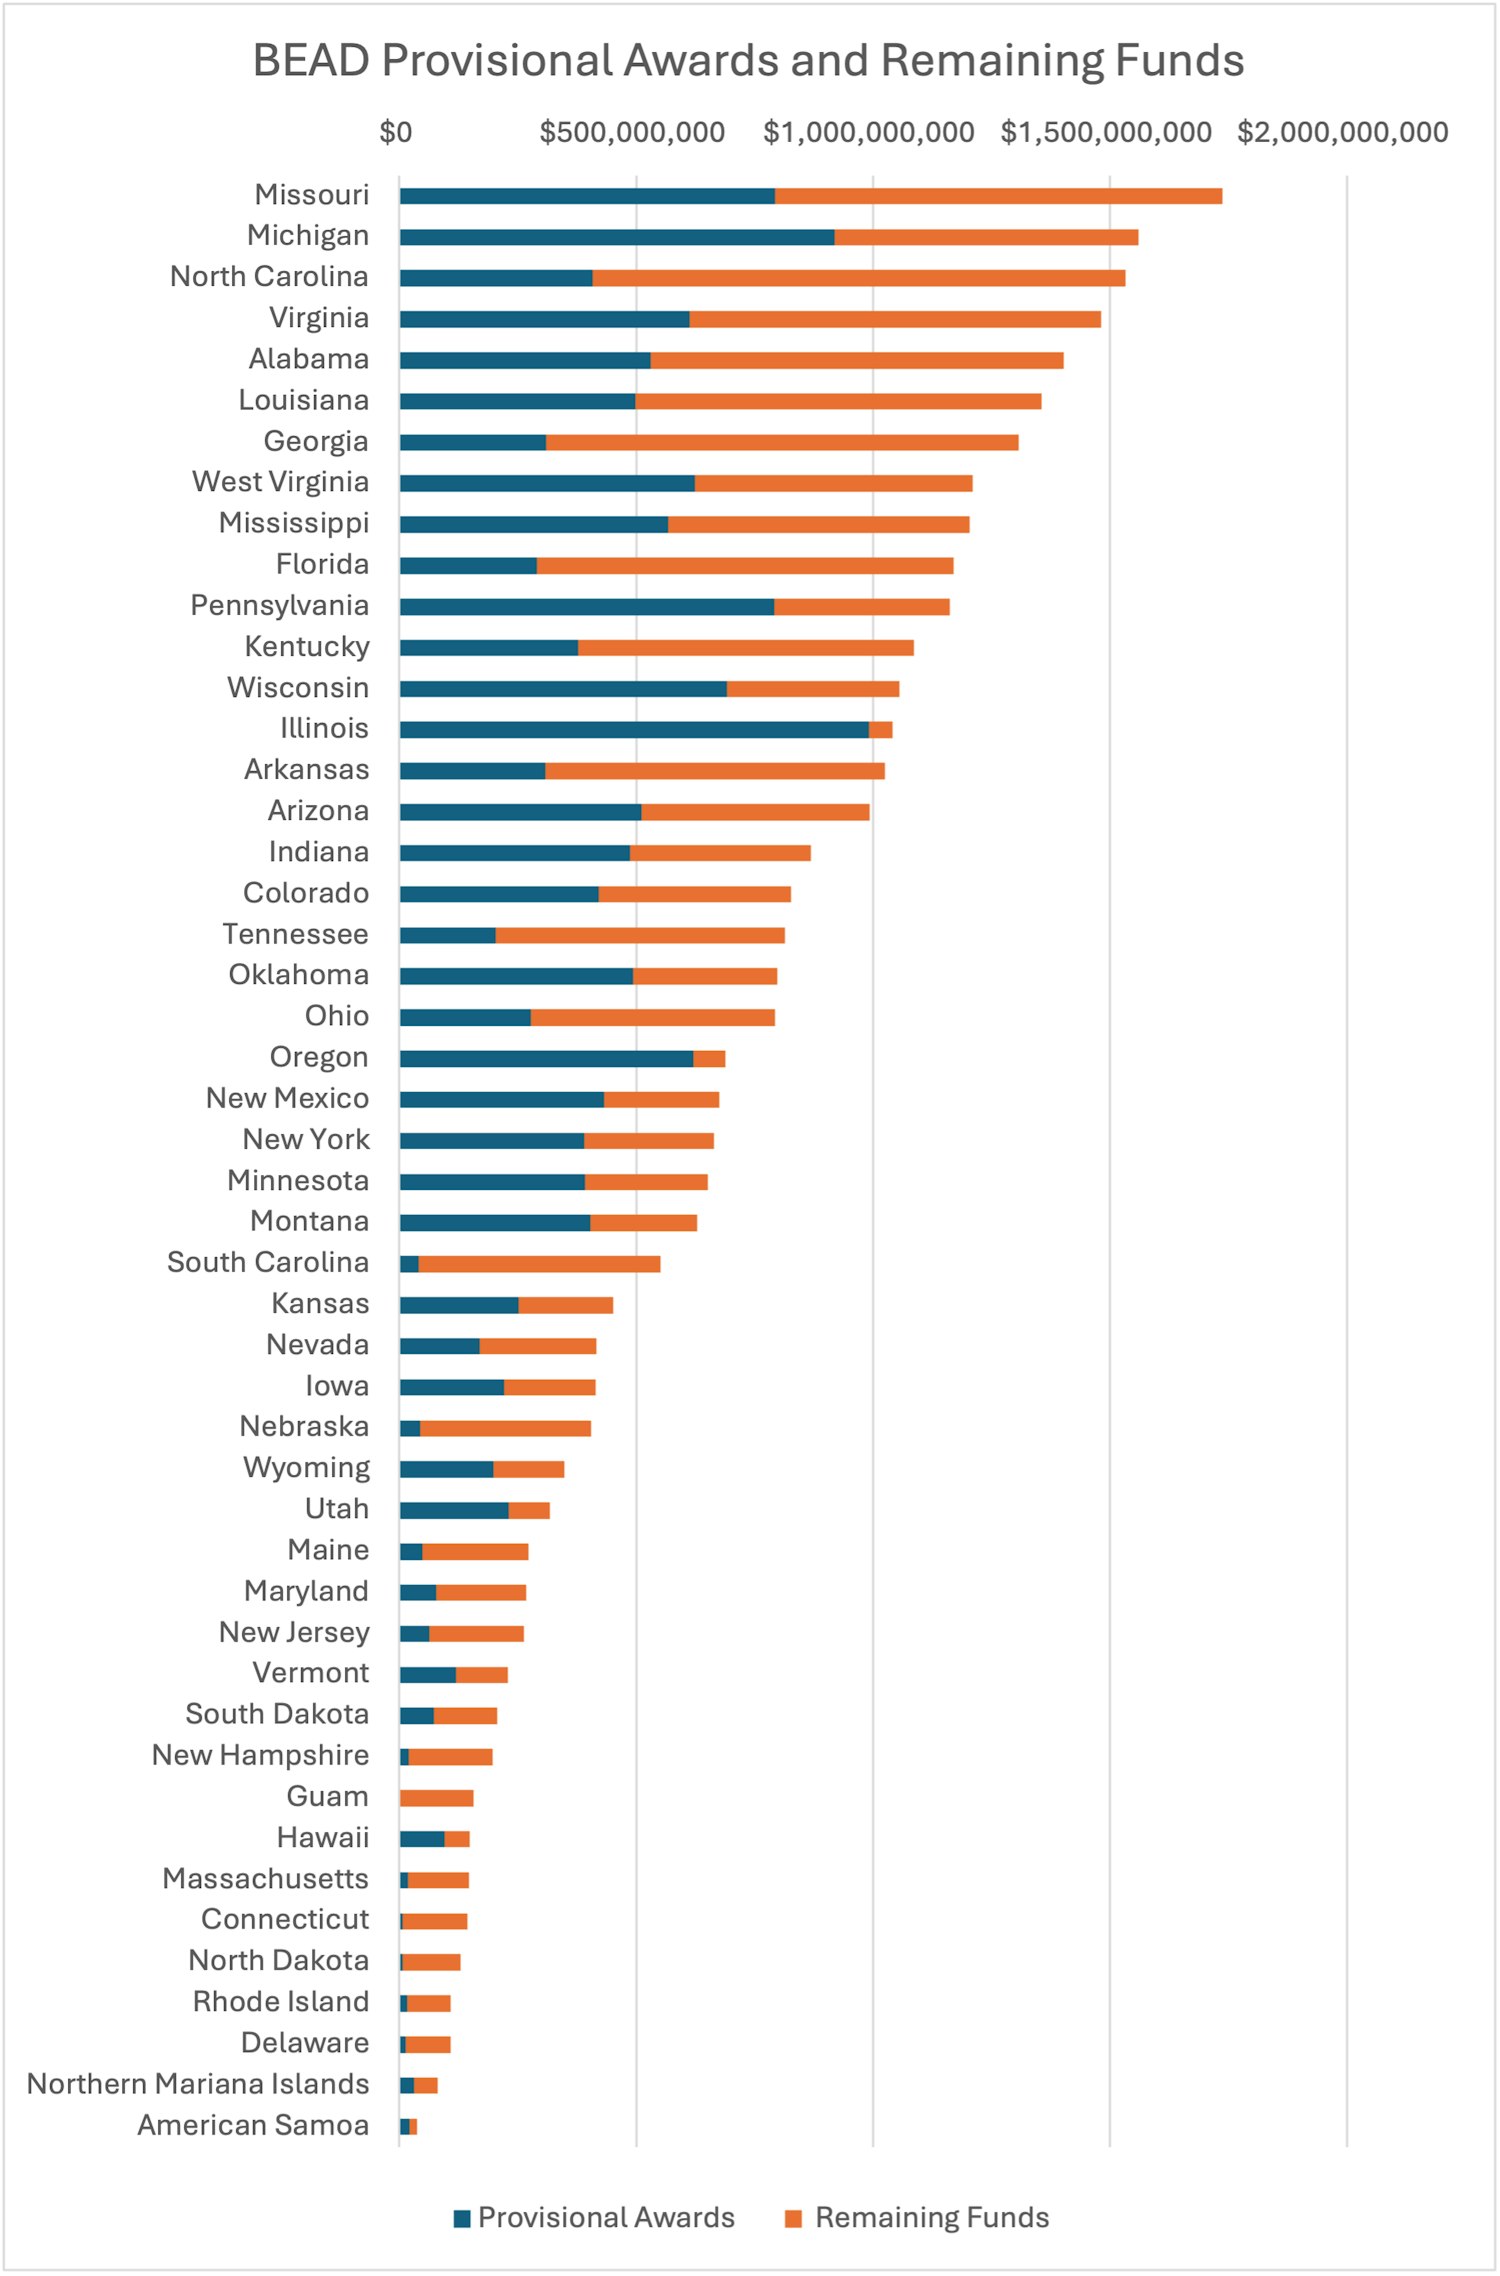
Reasons why the BEAD spend is less than expected include smaller coverage gaps and a recent restructuring of the program that pivoted sharply in the direction of cutting costs. Figure 2 shows the breakdown of awarded versus remaining funds in states that have submitted their Final Proposals.
Figure 2: The status of BEAD funds, state by state (for those who have submitted Final Proposals)
Fiber still leads in the BEAD tech mix
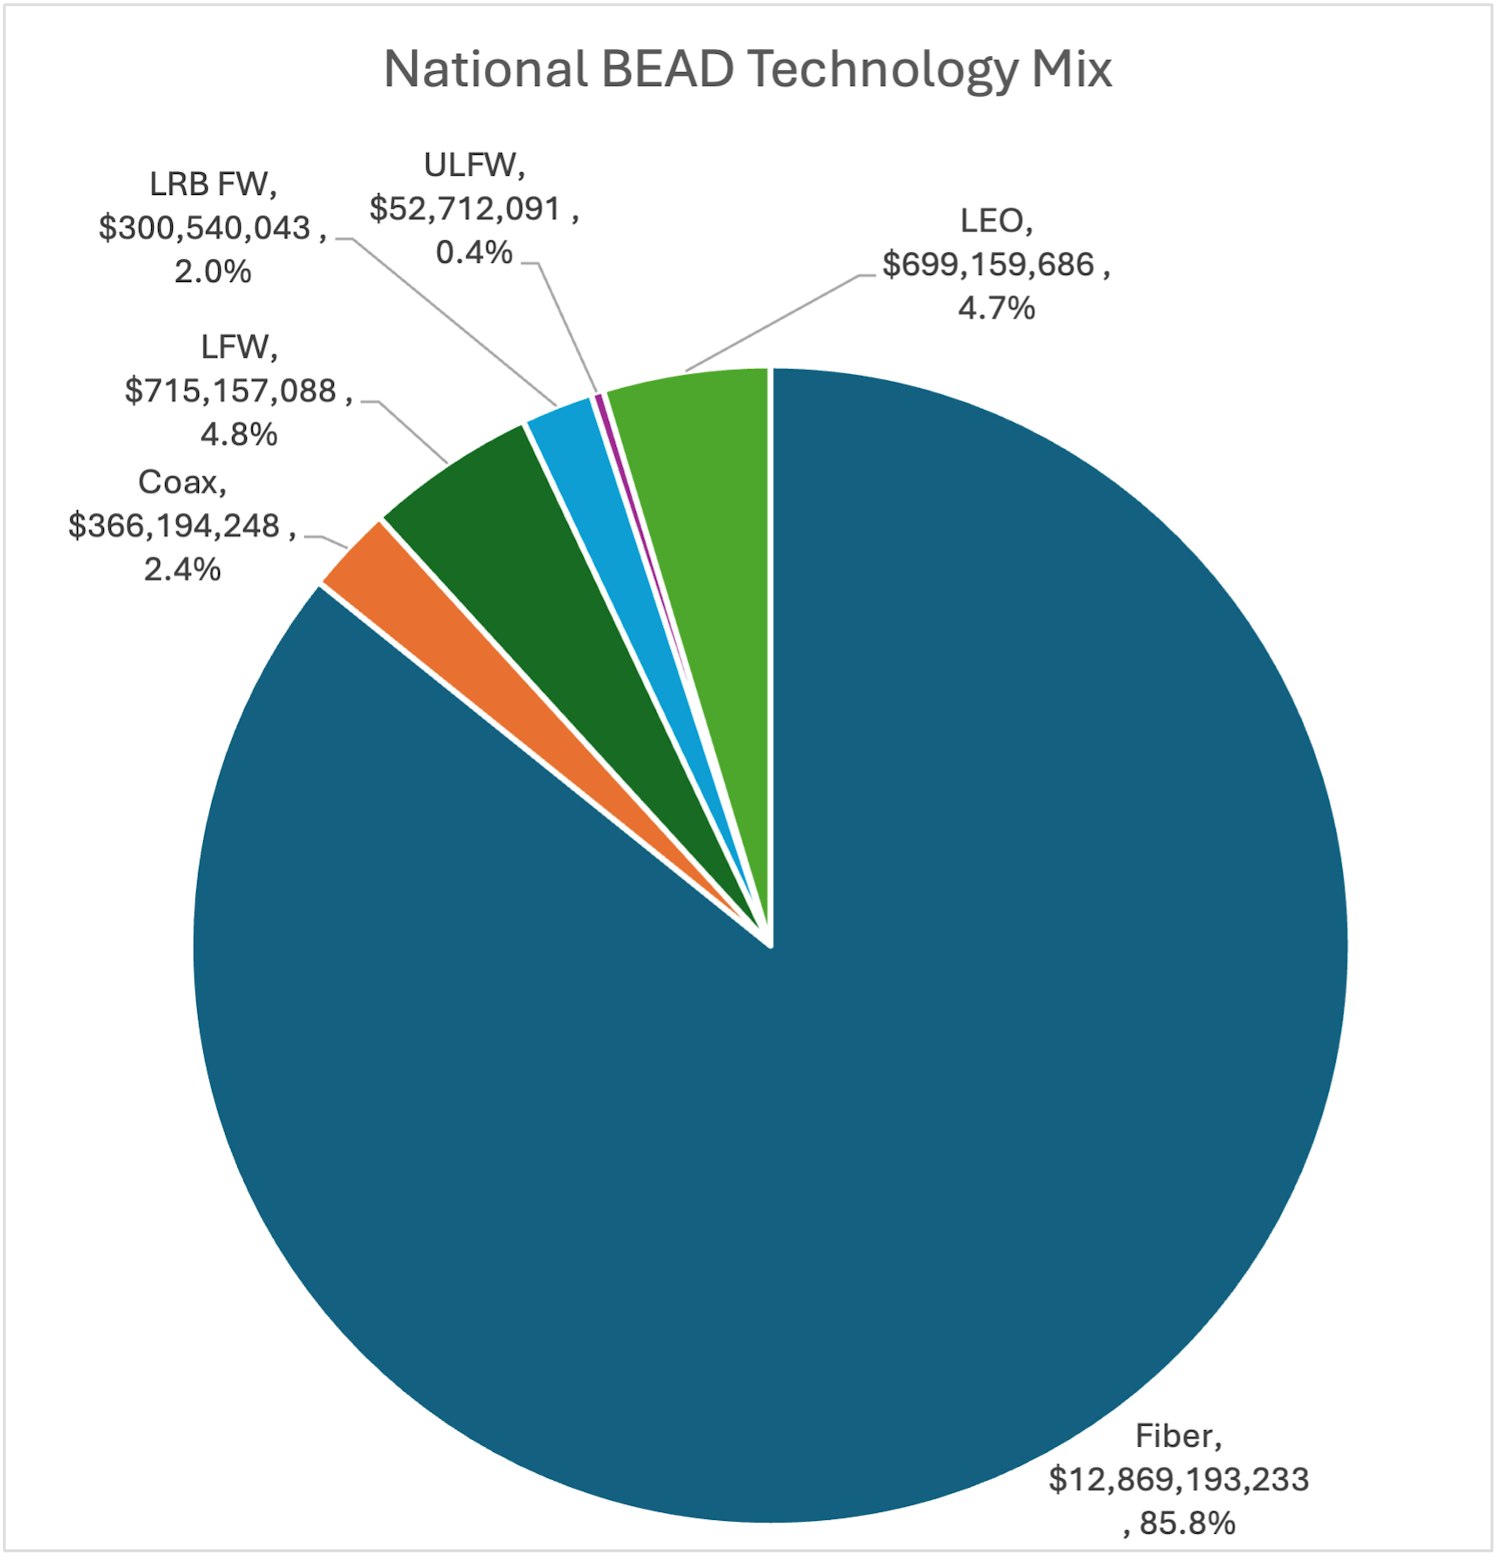
Despite a pivot from explicit fiber preference to technology neutrality, fiber projects have the largest footprint in the BEAD awards that have been announced so far, as shown in Figure 3.
Figure 3: Fiber has won most BSLs so far, though LEO has a substantial footprint
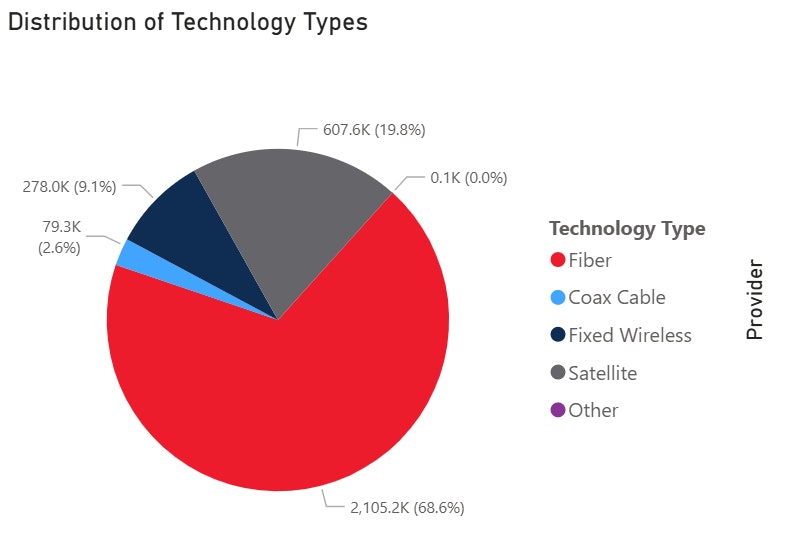
Source: CN BEAD Tracker
Fiber was dominant in most of the states that have posted Final Proposals so far, but a few had large amounts of fixed wireless and/or LEO satellite.
Figure 4: Fiber still leads the tech mix in most states
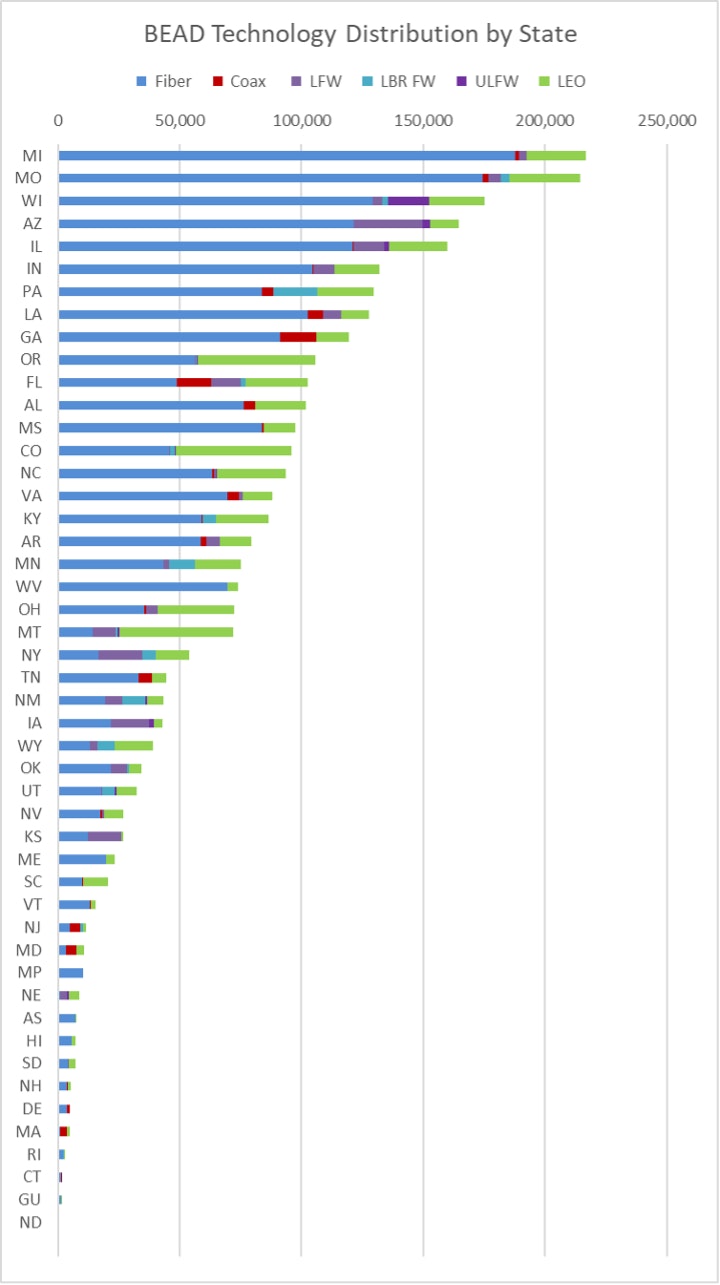
Final Proposals in Delaware, Louisiana and Nevada were initially approved in 2024, then rescinded with the restructuring, allowing for before-and-after comparison. In Louisiana and Nevada, the LEO satellite share of BEAD awarded locations jumped, from 2% to 9%, and from 11% to 29%, respectively.
In terms of its funding share, fiber is even more dominant, as shown in Figure 5.
Figure 5: Fiber projects have captured 80% of BEAD funding so far
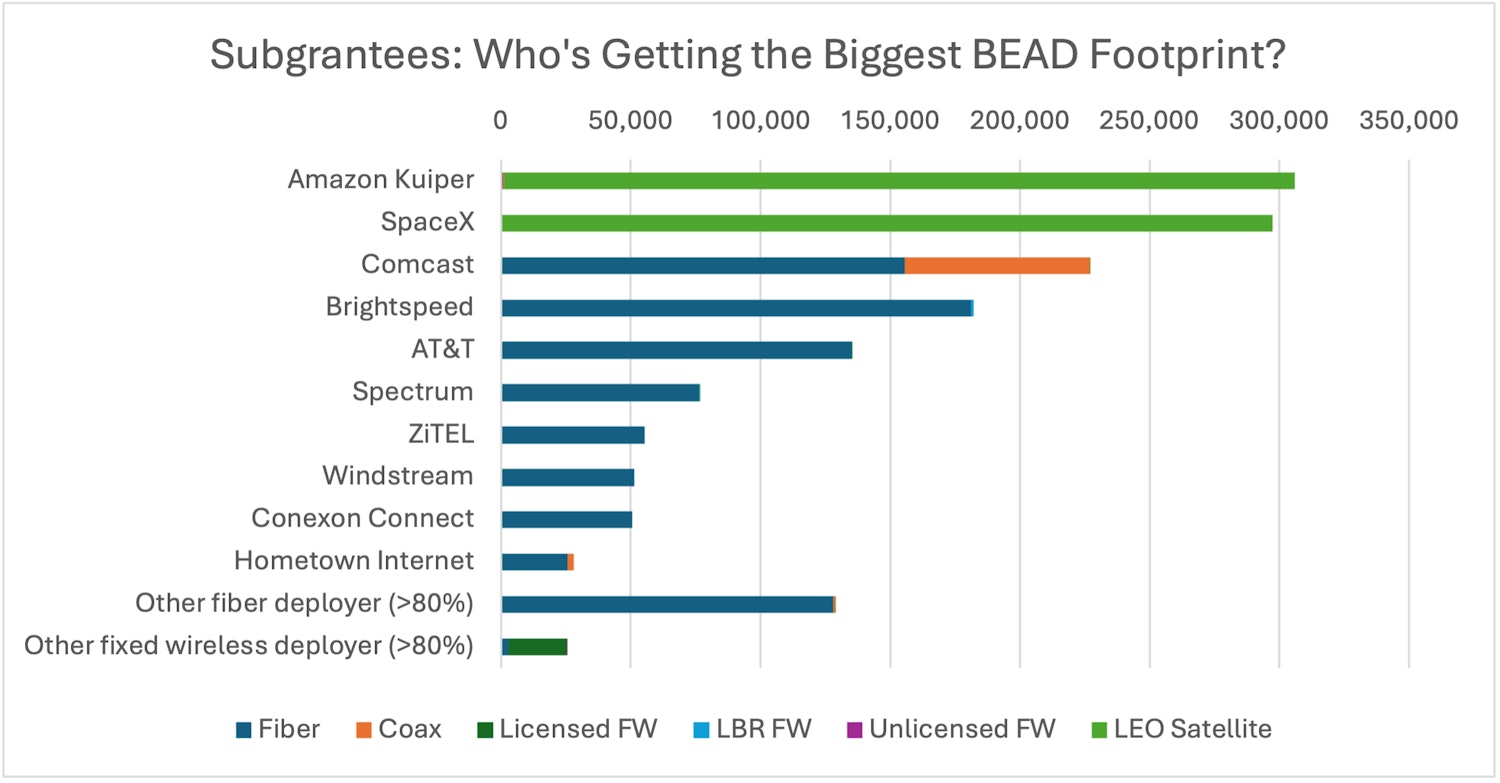
Top companies for BEAD awards
Figure 6 shows some of the top winners nationally, along with the technology distribution of what they propose to build. After the top ten winners, awardees are grouped by the main technology they propose to deploy: fiber or fixed wireless. (All the provisional awardees below the top ten in overall footprint proposed 80% or more of either fiber or fixed wireless.)
Figure 6: Top winners include national and regional ISPs, but awards are diffuse
Awards await NTIA approval
After Final Proposal submission, the next step in the process is for the NTIA to review the awards. In the Restructuring Policy Notice that it released in June, the NTIA reminded states that “to ensure that taxpayer dollars are protected, NTIA reserves the right to reject an Eligible Entity’s selection of a project for a subgrant if such project would impose unreasonable costs on the BEAD Program”—so some states’ plans may need revision before they get NTIA approval.
About the Author: Nathan Smith if the Connected Nation Director of Economics and Policy. Dr. Smith monitors federal broadband policy, writes public comments for federal agencies that request advice on broadband policy implementation, and helps with business development and proposals.