Update: 2017 Broadband Access in Indiana
Published by Center for Regional Development on June 4, 2019
By Roberto Gallardo
The Federal Communications Commission recently released their latest broadband deployment report using data from December 2017. Internet providers are required to file a report using form 477 twice per year on broadband access. While this dataset is known to have issues, including being carrier self-reported,

not granular enough (aggregates housing units into Census blocks), and showcasing advertised rather than actual speeds, it is the only broadband-related dataset available for the United States.
This dataset includes among other metrics, broadband technology available in that particular Census block (DSL, Cable, Fiber, etc.) as well as maximum advertised download and upload speeds. This in turn allows us to map the current broadband definition of 25 Megabits per second (Mbps) down and 3 Mbps up, or 25/3 for short, footprint for the state of Indiana.
Map below shows the 25/3 footprint in Indiana—excluding satellite—by technology as of December 2017.
Red areas indicate fiber is available while yellow areas indicate any cable technology available. Green indicates fixed wireless while light purple shows where DSL is available. Consider that since the fiber layer is on top, this does not mean other technologies are also available where fiber is shown.
When all is said and done, about 673,000 Hoosiers or 10 percent of the 2017 population lacked access to fixed 25/3 (white areas in the map) as of December 2017. In housing units, about 275,500 or 9.6 percent lacked access to fixed 25/3.
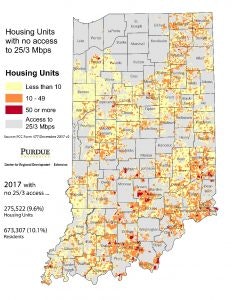
Map below shows the inverse of the 25/3 footprint. In other words, it shows the Census blocks where 25/3 was not available as well as the number of housing units in that particular block. Darker orange denotes blocks with 50 or more housing units unserved by 25/3. The gray area denotes parts of the state where 25/3 was available.
A pattern is visible where towns and cities do have access to advertised 25/3 but the surrounding areas in that county do not. For example, notice Rush or Knox counties.
Read the original article here
By Roberto Gallardo
The Federal Communications Commission recently released their latest broadband deployment report using data from December 2017. Internet providers are required to file a report using form 477 twice per year on broadband access. While this dataset is known to have issues, including being carrier self-reported,

not granular enough (aggregates housing units into Census blocks), and showcasing advertised rather than actual speeds, it is the only broadband-related dataset available for the United States.
This dataset includes among other metrics, broadband technology available in that particular Census block (DSL, Cable, Fiber, etc.) as well as maximum advertised download and upload speeds. This in turn allows us to map the current broadband definition of 25 Megabits per second (Mbps) down and 3 Mbps up, or 25/3 for short, footprint for the state of Indiana.
Map below shows the 25/3 footprint in Indiana—excluding satellite—by technology as of December 2017.
Red areas indicate fiber is available while yellow areas indicate any cable technology available. Green indicates fixed wireless while light purple shows where DSL is available. Consider that since the fiber layer is on top, this does not mean other technologies are also available where fiber is shown.
When all is said and done, about 673,000 Hoosiers or 10 percent of the 2017 population lacked access to fixed 25/3 (white areas in the map) as of December 2017. In housing units, about 275,500 or 9.6 percent lacked access to fixed 25/3.
Map below shows the inverse of the 25/3 footprint. In other words, it shows the Census blocks where 25/3 was not available as well as the number of housing units in that particular block. Darker orange denotes blocks with 50 or more housing units unserved by 25/3. The gray area denotes parts of the state where 25/3 was available.
A pattern is visible where towns and cities do have access to advertised 25/3 but the surrounding areas in that county do not. For example, notice Rush or Knox counties.
Read the original article here


