


The broadband competitive landscape on the eve of BEAD
Washington, DC (July 1, 2025) - In recent decades, broadband internet service has taken its place alongside other network utilities that define modern life, such as electricity, telephony, and to a lesser extent, piped water and sewer systems. The pandemic, when internet service could be a matter of life and death through the way it facilitated social distancing, clinched broadband’s status as a basic need.
As parts of the American Rescue Plan Act (ARPA) and the Infrastructure Investment and Jobs Act (IIJA), U.S. Congress responded with major broadband funding in pursuit of universal coverage, in the form of the $10 billion Capital Projects Fund (CPF) program, which is nearing completion, and the $42.45 billion Broadband Equity, Access, and Deployment (BEAD) program, whose funds should start flowing within the next year as a front-loaded planning phase bears fruit.
The broadband business differs from other utilities in its technological diversity. All electricity comes by wires. All water comes by pipes. But broadband internet service is provided by means of several different technologies. This creates a special policy challenge.
In its May 13, 2022, Notice of Funding Opportunity (NOFO), the NTIA interpreted a statutory definition of a “priority broadband project” to signify a single technology: end-to-end fiber. But on June 6, 2025, the NTIA released new guidance that replaces explicit fiber preference with a principle of “technology neutrality.” There is still a built-in preference for “priority broadband projects” that can “easily scale” to “meet the evolving connectivity needs of households and businesses,” among other criteria, but states are no longer allowed to equate “priority” with “fiber.”
How do the different broadband technologies compare? Fortunately, there’s good data about that, thanks to the Federal Communication Commission’s (FCC) Broadband Data Collection (BDC) dataset, which has been released twice per year since June 2022.
The existing reach and performance of the various technologies that are used to provide broadband internet service in the United States shapes the challenge facing state broadband offices and the BEAD program in defining and pursuing universal coverage. The data underscore that fiber-optic internet service has the best performance, so even with explicit fiber preference removed from the BEAD rules, end-to-end fiber projects can win on technology neutral criteria such as download and upload speeds.
However, it’s uneconomic to deploy fiber in some areas. The United States is on track to achieve some kind of universal broadband coverage in the next few years, but with a mix of technologies, not 100% fiber.
The reach and performance of different broadband technologies
The broadband competitive landscape in the United States is dynamic. The ongoing expansion of fiber and the retreat of DSL are rapid, and licensed fixed wireless service is getting faster. FCC data show that over 10 million locations were passed by fiber just in the 18 months between June 2023 and December 2024, as shown in Figure 1.

Figure 1 distinguishes between all locations served (red), locations served at speeds of at least 25 Mbps download and 3 Mbps upload (25/3) (blue), and locations served at speeds of at least 100/20 (green), which the FCC now defines as “broadband” and is the minimum standard that the BEAD program expects and seeks to make universally available. Figure 1 omits satellite services, whose reach is stable at 100%. Fixed wireless services are distinguished, following the FCC’s methodology, by the kind of spectrum that they use: licensed, unlicensed, or “licensed by rule” (including Citizens Broadband Radio Service, or CBRS).
The contrast among the three wireline technologies — DSL, cable, and fiber — is instructive.
DSL and cable rely on legacy infrastructures that were built for landline telephony and cable TV, respectively. While DSL is still widely available, it is obsolescent, and DSL services are being discontinued in many places. Few DSL internet service providers (ISPs) advertise the modern “broadband” speeds, as defined by the FCC, of 100 Mbps download and 20 Mbps upload, which the twisted pair copper wires of the old landline telephone networks struggle to support.
By contrast, cable internet service overwhelmingly meets modern connectivity needs and is the most widely available terrestrial broadband technology. But it’s not expanding. The cable TV networks were built out starting in the mid-20th century before fiber optics were invented and continuing through a big investment push in the 1980s, when fiber-optics were novel and expensive.
Today, fiber’s comparable cost and superior performance makes it the preferred choice for network expansions, but cable can do the job pretty well where it already exists. Often, this has led to “leapfrogging” dynamics, where rural areas lacking cable get fiber broadband before suburban areas and then enjoy superior speeds.
Fiber was a latecomer to the technology mix and is still playing catch-up to cable. But it’s racing ahead, with millions of locations being passed annually. The rate of fiber expansion would be enough to serve all locations with fiber in a decade if the rate of new passings were maintained. That, however, is not realistic, as fiber deployment pushes into less populated areas.
Fiber expansion was the biggest cause of the reduction of broadband coverage gaps by over 2 million in the 18 months from June 2023 to December 2024, yet most fiber expansion did not expand overall broadband coverage. Instead, fiber passed locations that already had access to cable internet.
The next biggest cause of shrinking coverage gaps is speed upgrades by licensed fixed wireless, which is increasingly able to meet the modern 100/20 “broadband” standard. But the evolving technological hierarchy of broadband speeds needs a closer look.
The technology hierarchy of broadband performance
Some broadband technologies offer faster speeds than others, forming a rough hierarchy. This has more to do with fundamental physics than business factors.
Fiber moves data by photons, cable and DSL by electrons. Photons and electrons have different physical properties. Similarly, fiber moves data through ultra-pure glass, while wireless services move it through air. Again, glass and air have different physical properties.
The resulting differences in speeds are shown in Figure 2, which features the time paths of the geometric average across all internet service offerings (one Broadband Serviceable Location or BSL, one ISP) of download and upload speeds from June 2023 to December 2024. Importantly, Figure 2 shows speeds in log scale. For comparison, the Appendix shows Figure 2 with a continuous scale y-axis, and the result is that the speeds of fiber dwarf everything else and make other patterns hard to see.

On average, fiber internet service considerably exceeds 1 Gbps download/1 Gbps upload, or gigabit symmetric. No other technology comes close. Superior speeds explain fiber’s rapid expansion, since it can dominate the competition when it’s available.
While physics factors make fiber’s superiority unassailable, other technologies have some capacity to boost speeds to meet rising data demand. In just the 18 months from June 2023 to December 2024, average cable upload speeds almost doubled, and fixed wireless also saw rapid growth in speed offerings.
Cable speed upgrades reflect the rollout of new DOCSIS industry standards, with DOCSIS 4.0 reallocating capacity somewhat in favor of faster upload speeds to reflect increasing demand for symmetric speeds in an age of videoconferencing. And fixed wireless has benefited from key innovations, such as advanced interference cancellation and multiple radios collaborating for stronger links, which have escalated attainable throughput dramatically, as reflected in the rising trends in Figure 2. However, adoption of these innovations is uneven, as shown in Figure 3, which is also in log scale (with a continuous scale version in the Appendix).

Figure 3 shows the distribution of download speeds by broadband technology. On this measure, cable is not far behind fiber. Cable internet usually offers gigabit download speeds. DSL is slowest overall, though some DSL beats some fixed wireless. Importantly, the variability of speeds differs by technology. Cable download speeds are fairly consistent, but for fixed wireless, the 90th percentile download speeds exceed the 25th percentile by more than an order of magnitude.
The technology hierarchy looks different for upload than download speeds, as highlighted by Figure 4, also shown in log scale with a continuous scale version in the Appendix:
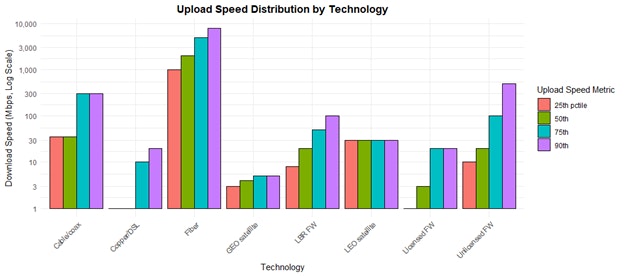
While cable internet almost matches fiber for download speeds, its upload speeds are far slower. Most cable upload speeds are probably still fast enough to meet most people’s needs, but cable broadband falls far short of the symmetric speed offerings that fiber tends to offer.
The provision of faster download relative to upload speeds partly reflects business factors. Before the pandemic, internet use patterns tended to demand much more download than upload, for purposes like video streaming. The rise of remote work has enhanced the need for symmetric speeds, and cable ISPs can adapt to some extent. But the vastly superior throughput capacity of fiber removes the need for such trade-offs.
Meanwhile, while fixed wireless is consistently inferior to cable on download speeds, it often beats cable on upload, and the 90th percentile unlicensed fixed wireless upload speed is roughly twice the 90th percentile cable upload speed. Fixed wireless ISPs that rely only on licensed spectrum tend to be limited by the smaller range of frequencies that are available for licensing.
Scalability
Some federal and state broadband programs in recent years, now including BEAD, have favored projects that are “scalable,” in the sense that, after the infrastructure is installed, speeds can be upgraded over time. Figure 5 underscores the importance of scalability by showing the prevalence of speed upgrades for persistent service offerings.

Figure 5 shows that in just 18 months, a substantial fraction of the service offerings for each technology — to the extent that they could be traced over time — had experienced speed upgrades. The exception is DSL. Although speed is a major pain point for DSL, there’s just not much improvement possible over twisted pair copper wires.
At the other extreme, speed upgrades are easy for fiber ISPs, which tend to install many extra strands and leave them “dark” for lack of demand but rarely are necessary, since fiber is already so fast.
Cable ISPs were much more likely to upgrade their upload than their download speeds. Cable speed downgrades were very rare. By contrast, speed downgrades for fixed wireless, though less common than upgrades, were not rare.
More customers on a fixed wireless service can force speed downgrades because more users must share the same network throughput. Fixed wireless service offerings, especially the unlicensed ones, were also frequently untraceable between data vintages, reflecting greater provider turnover.
Sometimes, ISPs can increase speeds over legacy networks through investments in electronics or software. Where this is feasible, it can be a cost-effective way to meet modern internet service needs. The scalability of speeds on existing networks can make an important contribution to expanding broadband and closing the Digital Divide. But it’s not safe to assume that speed upgrades can persist indefinitely, and speeds can go down as well as up. In some cases, speed downgrades may reflect an ISP’s inability to increase throughput in step with rising data demand, forcing them to ration bandwidth.
Leveraging technological diversity to pursue universal broadband coverage
The variety of competing broadband technologies complicates the policy challenge of working toward universal broadband coverage in a fair and efficient way. BEAD’s pivot from explicit fiber preference to technology neutrality should not obscure the facts that a.) there’s a hierarchy of performance among broadband technologies, and b.) BEAD was always on track to achieve universal coverage by means of a technological mix and not fiber alone.
In particular, there’s no plan and no need, at present, to subsidize the replacement by fiber of cable internet that uses legacy infrastructure to deliver modern broadband speeds. This has consistently been reflected in BEAD’s eligibility rules, which exclude almost all BSLs that are served by cable. But by what technology should the needs of the remaining unserved and underserved BSLs, which overwhelmingly do not have access to cable, be met?
Combining the reach of many broadband technologies, and taking all BSLs as the universe, Figure 6 shows a typology of broadband competition in the United States and gives a glimpse of the remaining coverage gaps that the BEAD program will seek to address.
The vast majority of BSLs in the United States are already served by fiber and/or cable. They can order internet service at very fast speeds, though many areas suffer from a lack of competition. BEAD will generally focus on the 5.9 million BSLs whose only 100/20 internet service option is Starlink, and some of the 4.3 million additional locations had 100/20 internet service offerings only by DSL and/or fixed wireless.
That said, the BEAD footprint will not precisely match the coverage gaps in the BDC data, because a.) BEAD excludes areas where funded deployment commitments are in place under previously existing grant projects, and b.) state-specific challenge processes have modified the maps somewhat.

While the remaining broadband coverage gaps contain less than 10% of the nation’s broadband serviceable locations, they contain most of the U.S. landmass and are far lower in population density, as shown in Figure 7, which calculates land area and population for census tracts based on descriptions of their current coverage.
The typology of census tracts used in Figure 7 ranks tracts from right to left, such that they graduate to the next tier if they have a.) more than 50% coverage by terrestrial broadband, b.) more than 30% wireline coverage, c.) more than 80% wireline coverage, with the top four tiers based on different configurations of competition among fiber and cable, and so forth. Classifying census tracts in this way provides a basis for describing how coverage gap areas differ from served areas.

Together, tracts dominated by either robust wireline competition, fiber-vs.-cable duopoly, or cable wireline monopoly, contain 81% of BSLs, yet comprised only 14% of the U.S. landmass. Most of these places have hundreds or thousands of BSLs per square mile. Such high population densities make the economics of broadband deployment highly favorable due to the ability to serve many customers with relatively short lengths of infrastructure.
In essence, the “low-hanging fruit” of dense urban and suburban areas has largely been addressed, and we are now faced with the more expensive and challenging endeavor of connecting the less densely populated parts of the country.
The median census tract where either LEO service only, or LEO with a little fixed wireless predominates, has just over 10 BSLs per square mile. As the BEAD program seeks to push broadband deployment into the remaining coverage gaps, it will need to find solutions for areas like these. Although fiber has shown some propensity to push into relatively low population density areas where cable never reached, the escalating costs of deploying in sparser areas must be expected to put a limit on how far fiber can go. Upgraded fixed wireless service can meet some of these needs, but some BSLs are expected to be allocated to LEO satellite service in some way.
As the coverage gaps close, broadband mapping needs to keep improving
A few years ago, the above analysis of broadband coverage would not have been possible. The Broadband DATA Act of 2020 mandated that the FCC map broadband coverage in a way that is granular to the location level, resulting in much more informative coverage data than was previously available through the Form 477 process that only asked ISPs their maximum advertised speed per census block.
But broadband coverage data still has its limitations, and much of the difficulty of administering the BEAD program has resulted from federal and state agencies’ limited knowledge of the facts on the ground about coverage.
While universal coverage has in some sense already been achieved thanks to LEO satellite constellations beaming internet service from space, many connectivity pain points, from latency to reliability to affordability, remain. But we don’t have good data about them. Better broadband mapping will be needed to refine what universal broadband coverage ought to mean, and to shed more light on how close to achieving it we really are.
Overall, much progress has been made. Everyone belongs in a Connected Nation. We’re almost there.
Meet your author
Dr. Nathan Smith
Dr. Nathan Smith monitors federal broadband policy, writes public comments for federal agencies that request advice on broadband policy implementation, and helps with business development and proposals

APPENDIX: Broadband speed charts in continuous scale
Figures 2, 3, and 4 were displayed with a log scale y-axis. The same data look different if shown with a continuous scale y-axis. Since fiber’s extremely fast speeds tend to dwarf other technologies, fiber is omitted from the last two charts to make them easier to read.


