


The Broadband Readiness Index: CliffsNotes to the National Broadband Map
Dallas, TX. (May 18, 2011) - This week at the Telecommunications Industry Association’s 2011 Inside the Network conference in Dallas, Connected Nation released the Broadband Readiness Index, a new tool that translates the vast, multi-layers of data in the National Broadband Map into a transparent, easy-to-use means to benchmark how prepared communities are to meet goals set by the National Broadband Plan and the President’s Wireless Innovation Initiative. This information will help community leaders and state policy makers better understand their broadband challenges and trigger meaningful strategies to address them.
The Broadband Readiness Index is applicable to the supply-side or network challenge, one of three core challenges facing each community: network capacity, technology adoption at the home and place of business, and usage of applications and online solutions in schools, libraries, health centers, public safety, courts and local administration agencies, and across the community ecosystem. Understanding all three of these prongs is necessary to understand a community’s strengths and weaknesses in an online world.
The Broadband Readiness Index addresses the first of these three components and is based on National Broadband Map data from fall 2010. Fall and spring updates to the Broadband Readiness Index will take place twice a year following NTIA’s updates to the National Broadband Map.
Connected Nation works with the NTIA and partners in 11 states and Puerto Rico to collect, integrate, and validate the underlying broadband inventory information that informs these maps. As such, CN fully understands the relevance and power of the National Broadband Map, as well as its complexity. Connected Nation has been working with such data since 2004, when we produced the first statewide, granular broadband map in Kentucky. CN commends the diligence and creativity of the NTIA and the FCC’s GIS team who charged through more than 25 million data records to produce the nation’s first interactive broadband map. Compiling the many layers of information that are available to the public in a user-friendly format is nothing short of a remarkable feat, which CN is proud to be involved with.
Yet, for those unfamiliar with the data layers available through the National Broadband Map, extracting information for pragmatic policy development can be a taxing process. The technical nature and sheer volume of the data can be a challenge for local leaders and state policy makers who seek to build pragmatic policies to help push broadband and the new economy forward. Lacking expertise in broadband technology and trends, many of them are asking basic questions such as: “What is the relevant metric? Is it 768 download speed and 200 upload speed Kbps? 3 Meg? 100 Meg? What is a Meg anyway?” And, “OK, so we have got 93% of households connected at basic broadband speeds in our county, how does that compare with the rest of the nation? Is that enough? Will our community lag behind in the coming years if we are not able to attract investment in speeds of 10, 25, or 50 Megs?”
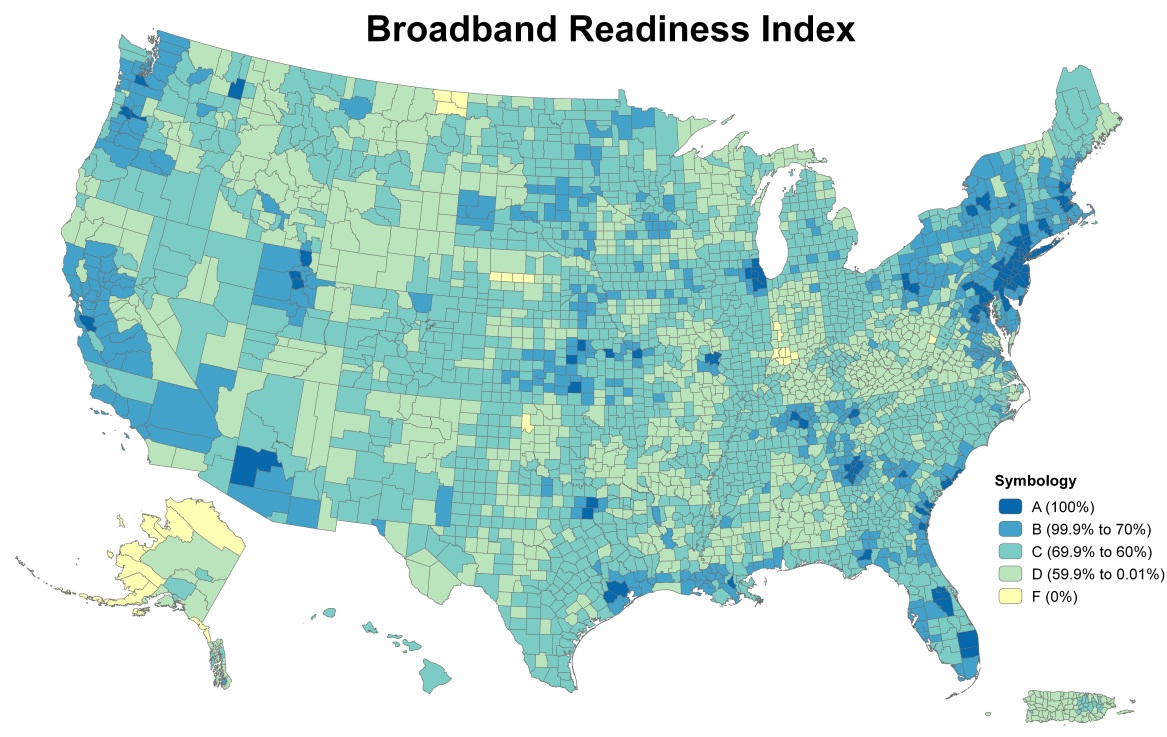
The Broadband Readiness Index addresses these questions using county-level data for the nation’s 3,219 counties in all 50 states, the District of Columbia, and Puerto Rico, on three network metrics: 100% of households served at 3 Mbps download/ 768 Kbps upload speeds, 98% of households served by mobile service, and 85% of households served by 50 Mbps download speed broadband service. These three metrics are not chosen by CN, they correspond to key national broadband goals set by the White House and the FCC. By incorporating the network inventory data from NTIA with the national benchmarks, each county is then given a grade from A to F for all three metrics, depending on how closely it meets the benchmark. Each county then receives an overall Broadband Readiness Index grade based on the average across the three metrics.
The results of this exercise are revealing to local and national leaders alike. Based on Connected Nation’s Broadband Readiness Index, over two-thirds of all counties containing 91.6% of all households receive a passing grade. These counties are in urban areas with densely compact households, including some of the largest metropolitan areas in the U.S.: New York, Philadelphia, Chicago, and Atlanta. By contrast, nearly 32% of counties containing approximately 8.4% of the population receive a failing grade. These areas are sparsely populated (with less than 7.9 households per square mile), indicating network build-out costs are a key challenge in upgrading the network capacity in these areas.
Most communities are ready to meet the national broadband goals for wireline and wireless access at basic speeds, but important challenges remain across the nation. By contrast, many communities across America outright flunk the 50 Mbps capacity challenge. In the fall of 2010 a majority of counties – almost three fourths of all U.S. counties with 45% of the nation’s households – have no access to the advanced technology of 50 Mbps.
For further results and more information on Connected Nation’s Broadband Readiness Index, see http://www.connectednation.org/research/readiness_index.php
By Raquel Noriega, Director, Public Policy, Connected Nation